

Project information
- Category: Visualization & Analysis
- Project date: 14 JUN 2022
- Project File: Github
Senior Project for Bachelor of Engineering in Analysis of the induced voltage generated by transmission line.
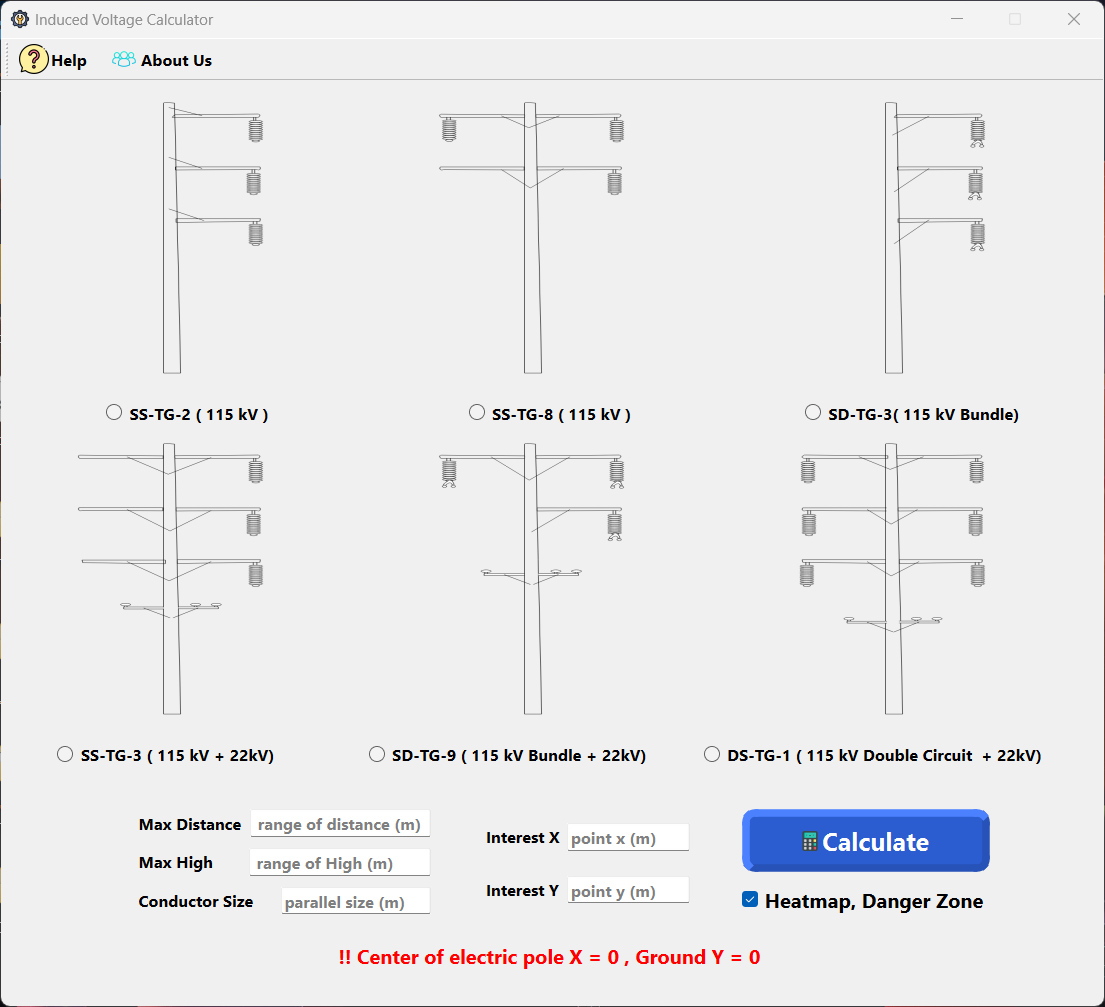
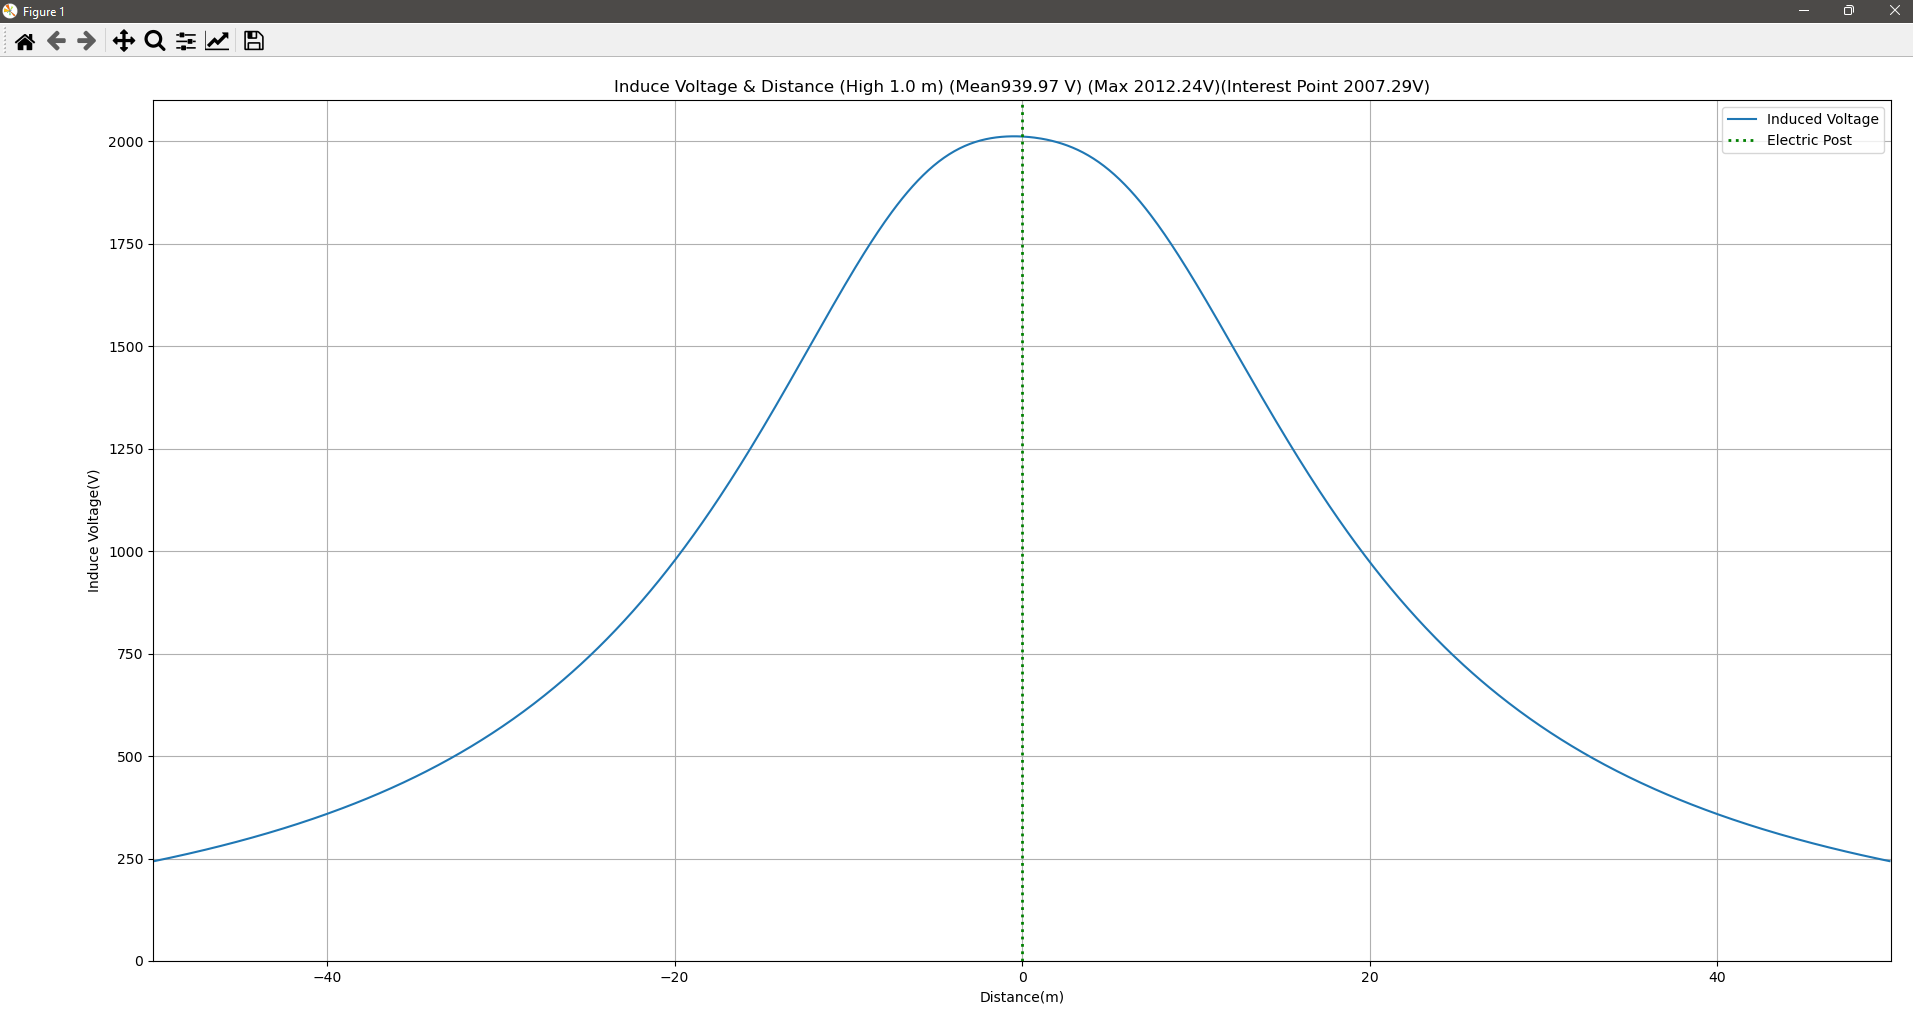
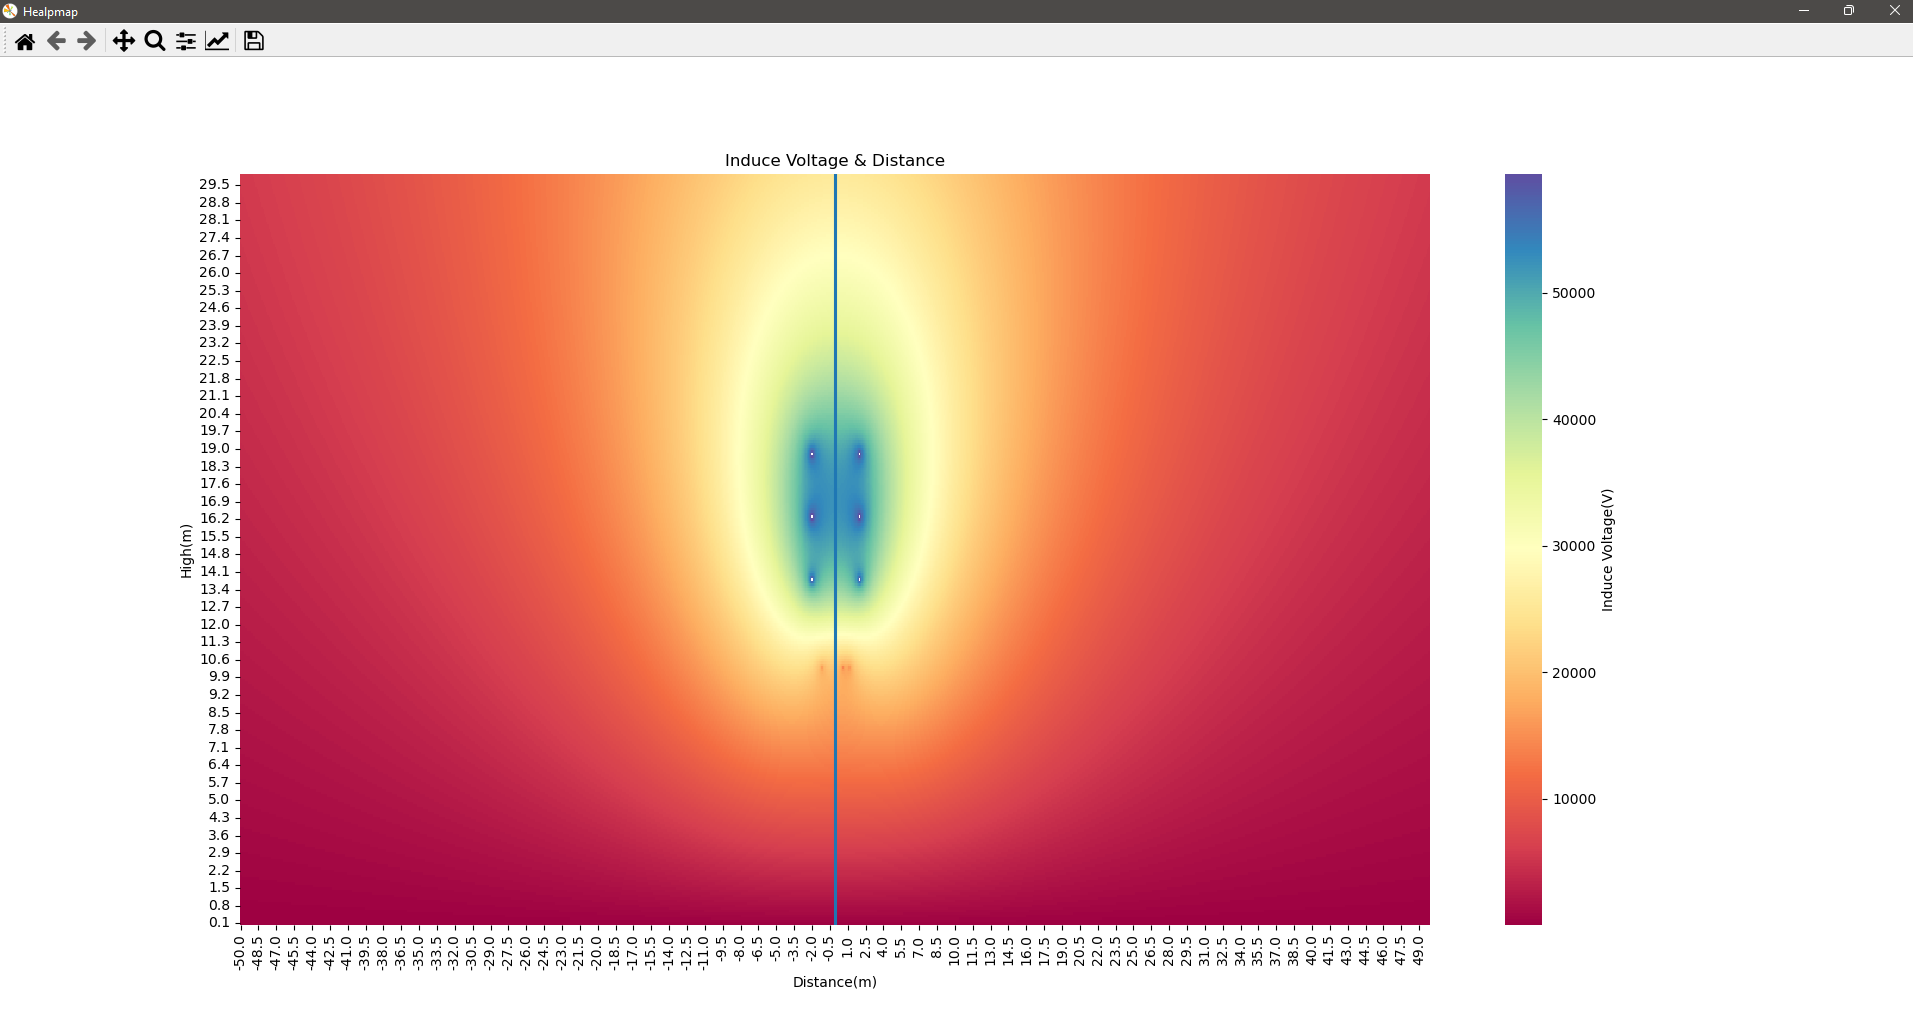
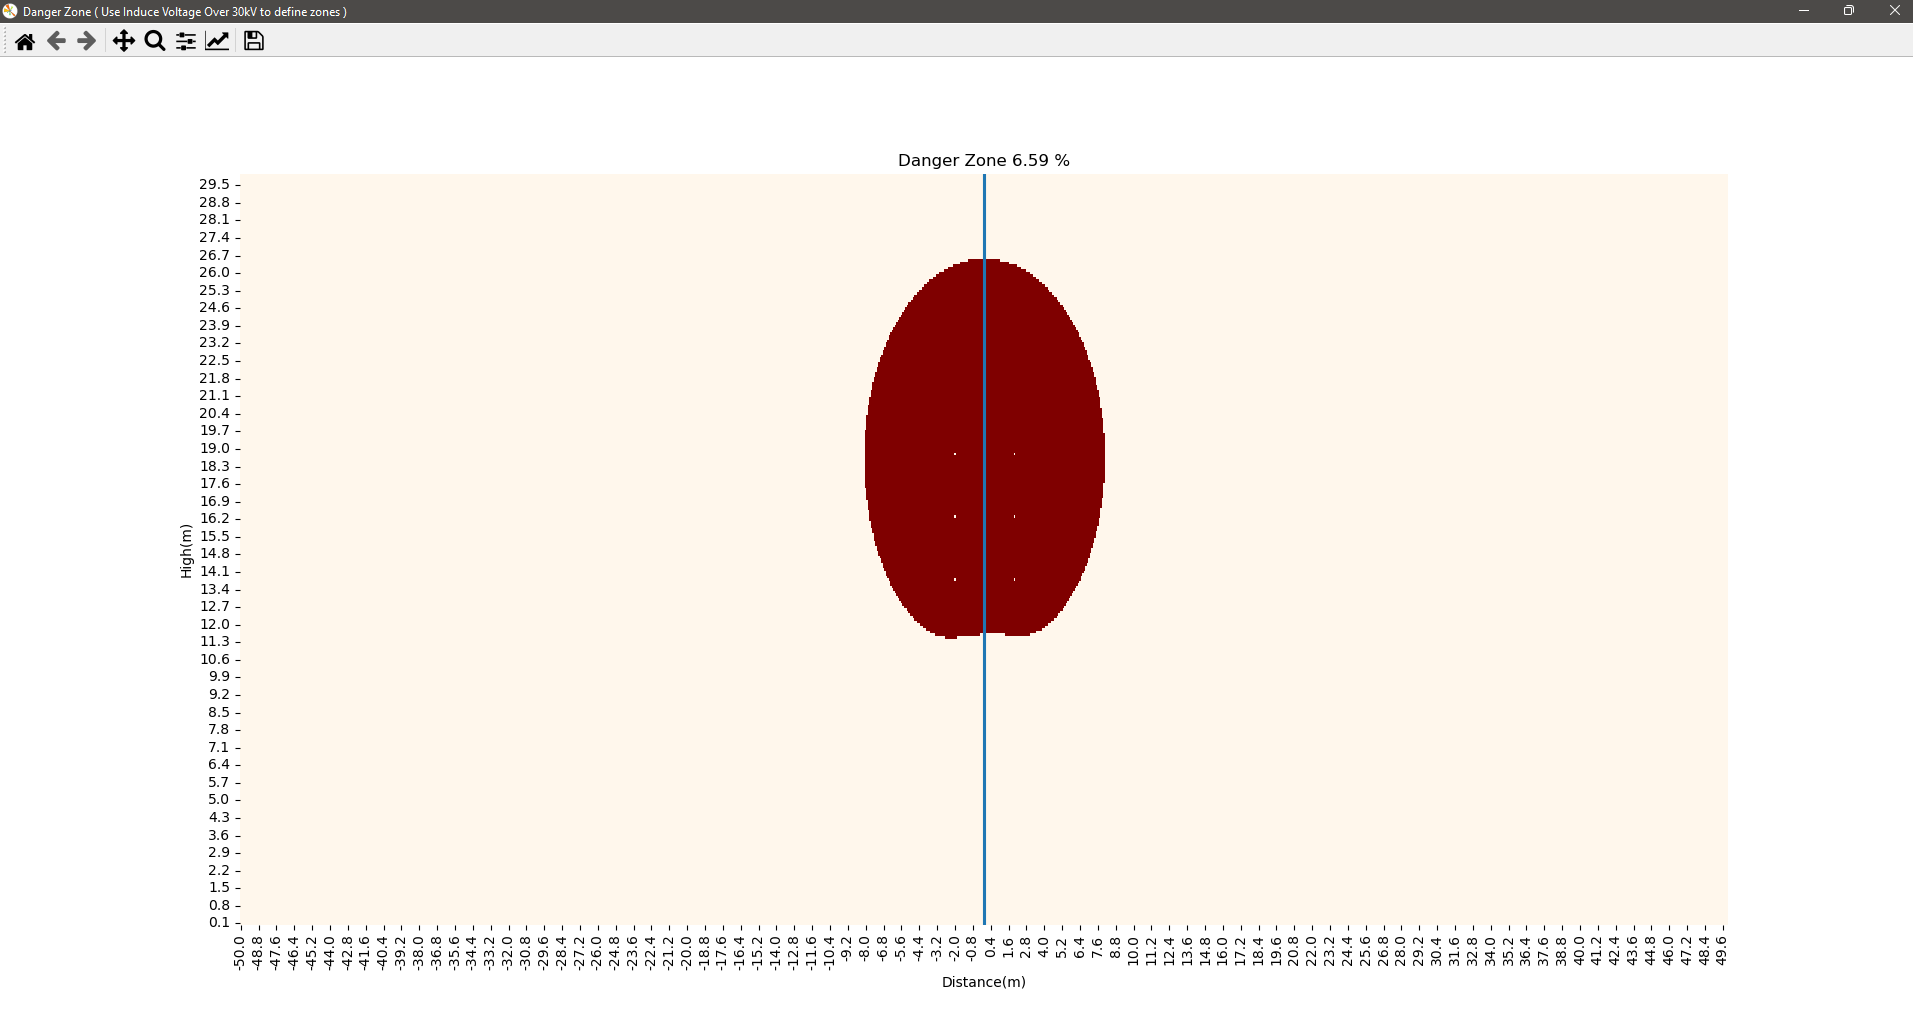
At present, there is a rapid increase in electricity consumption has resulted in community areas encroaching on the safe distance of transmission lines. This area is an area with high electric and magnetic field intensity. This creates an induced voltage on ungrounded conductors, which is dangerous for people in contact with such conductors. To avoid potential hazards, it is important to determine the induced voltage. Direct induced voltage measurements are complex. This project presents a software for calculating the inductive voltage at normal operating conditions arising from six types of 115 kV power towers used in the Provincial Electricity Authority. The results of the calculations were applied to find the hazardous area using two criteria: one using induced voltage obtained from a safe distance from the Provincial Electricity Authority, and the second using an electric current that flows through the human body which causes loss of muscular control. From the results, it was found that the pole type SS-TG-3 has the least dangerous area because it is a mixed circuit transmission tower with both transmission line (115 kV) and distribution lines (22 kV), resulting in the electric and magnetic fields of both systems being canceled. It also uses a single conductor for each phase, so the distance from the conductor to the point of interest is greater than the bundle conductor.